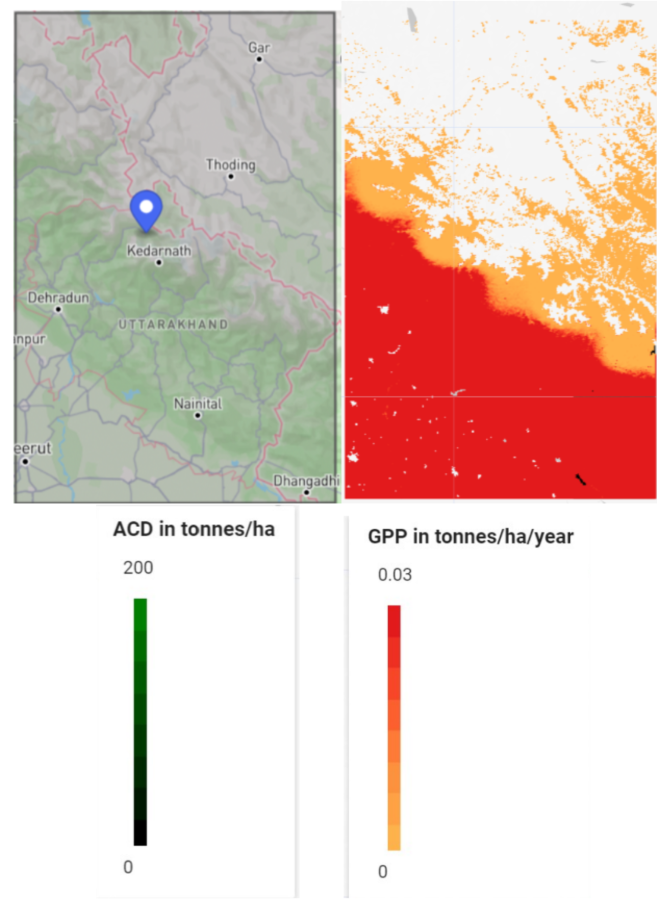
Figure 1. ROI, Figure 2. CSPI Map
Region of Interest: Uttarakhand and its borders with Himachal Pradesh, Tibet and Nepal.
A map to aid Carbon offset efforts in the Himalayan North of India
As part of SDG 13. Climate action, government policy and action plans to achieve carbon offsets have been on the rise globally. In the last two decades, many Protected Areas (PAs) and national parks in forested regions have been established. PAs are usually established in those regions that are forested and have reached their maximum capacity to store carbon. On the other hand, there are certain unforested regions that have not reached there maximum carbon storage capacity and can be forested to sequester more carbon from the atmosphere. Statistical and visual data on maps can provide important information to guide decision-making on determining suitable locations for PA establishment and afforestation projects
The main variable to ascertain the carbon storage potential of an area is called the Carbon Storage Potential Index (CSPI). It depends on three other variables: First, the Gross Primary Product (GPP), which is how much carbon a forest unit can take-in from atmosphere and convert into vegetation. Second, the aboveground carbon density (ACD) is the mass of forest biomass per unit volume of the forest unit. An area with high ACD is usually more forested (high forest cover (FC)). Therefore, the CSPI is the ratio of GPP to the vegetation biomass in an area. Essentially, how much more carbon can be put into the forest before it reaches full capacity. It is needed to determine which management units have low sequestration potential and should be protected (high ACD, high GPP, high FC, and low CSPI), and which ones have high sequestration potential and should be reforested/afforested (low ACD, high GPP, low FC, and high CSPI). Low CSPI areas have already saturated in their carbon storage capacity. While High CSPI indicates that lots of plants have a high capacity for carbon storage but are not grown into forests.
This map displays the CSPI in the regions in and around the state of Uttarakhand (in northern India) and its border with Nepal (Figure 1.). The purpose of this map is to aid forest management and guide carbon offset efforts on a regional scale. This map displays regions with high carbon density that need to be protected. Additionally, it reveals those areas that have potential to store carbon.
As for the interpretation of this map of Uttarakhand, the ACD values were only computed for a small portion of my ROI at the border between Uttarakhand and Nepal. This part of the map is shown in Figure 3. Most of this zoomed-in region at the Uttarakhand and Nepal border has a high ACD (Greener) and high GPP (redder). This could mean that its forested region is likely saturated in terms of carbon storage, and thus has low CSPI. But since it has reached maximum carbon storage capacity, it should be protected/conserved. Furthermore, the tiny, blackened region at the bottom left of Figure 4 shows the region surrounding Dhangadhi, Nepal, and indicates a low ACD and high GPP, and thus has the potential to sequester carbon from the atmosphere if forested.
This project involved mostly working with code in Google Earth Engine (GEE). The satellite imagery of Uttarakhand was obtained from an open source GeoJSON and converted to a shapefile. This shapefile was then imported to the GEE code, to perform calculations to obtain the ACD, FC, GPP, to finally measure the CSPI of management units within my region of interest.
Region of Interest: Uttarakhand and its borders with Himachal Pradesh, Tibet and Nepal.
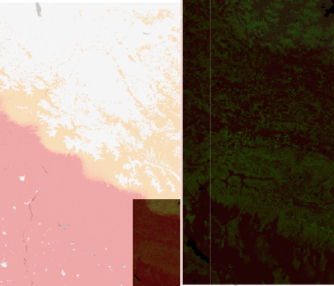
ACD in the East of Uttarakhand, and its border with Nepal. Greener in the north with a high ACD and more forested, and blacker in the south, with low ACD and less forested.
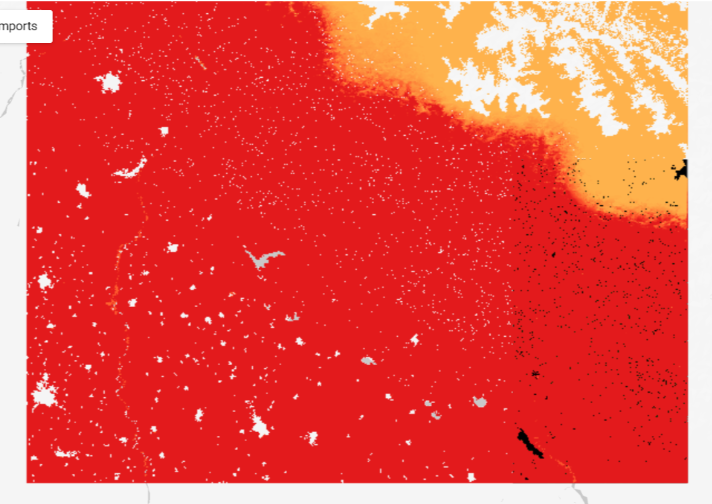
Dhangadhi and surrounding region having a High GPP and low ACD, hence has a high CSPI.