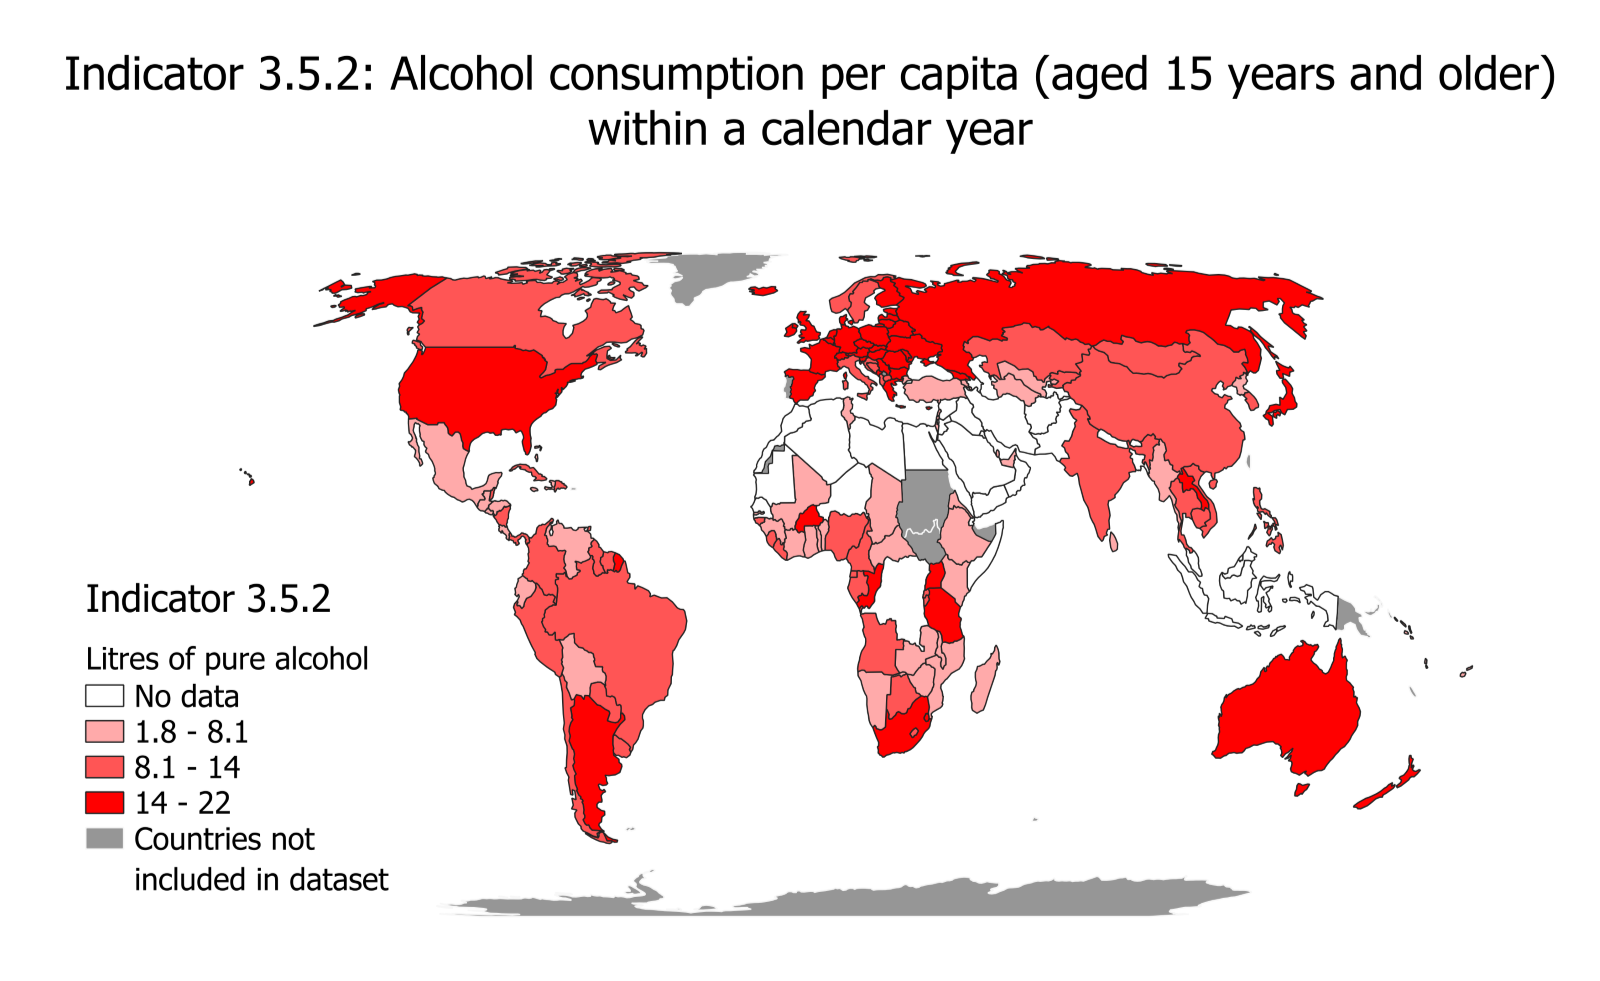
SDG Indicator 3.5.2 Choropleth Map
Alcohol consumption per capita (≥15 years age) within a calendar year for the latest year 2019.
Hello! My name is Priyal Ranka, and I am from Bangalore, India. I have just completed the 2nd year of my undergraduate degree at University College Utrecht, The Netherlands. My majors include Earth & Environment, Anthropology, and Economics. Besides these tracks, I am also interested in and have taken courses in Media Studies, Literature, and Philosophy.
I am passionate about environmentalism, and strongly believe in interdisciplinarity as a tool to combat the ecological and humanitarian crises we are facing today.
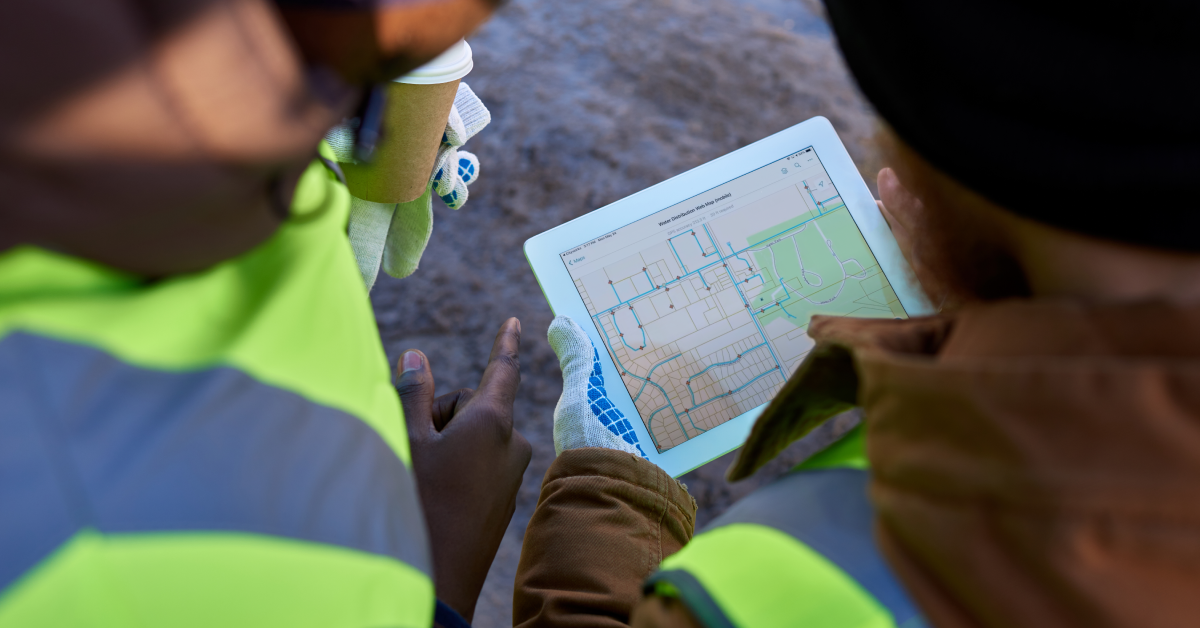
One such interdisciplinary tool I have been introduced to at university is Geography Information Systems (GIS), which is a technology used to create, manage, analyze, and map all types of spatial data. On this website, I share the main maps I created using varied spatial data-types and software systems, to serve distinct purposes.
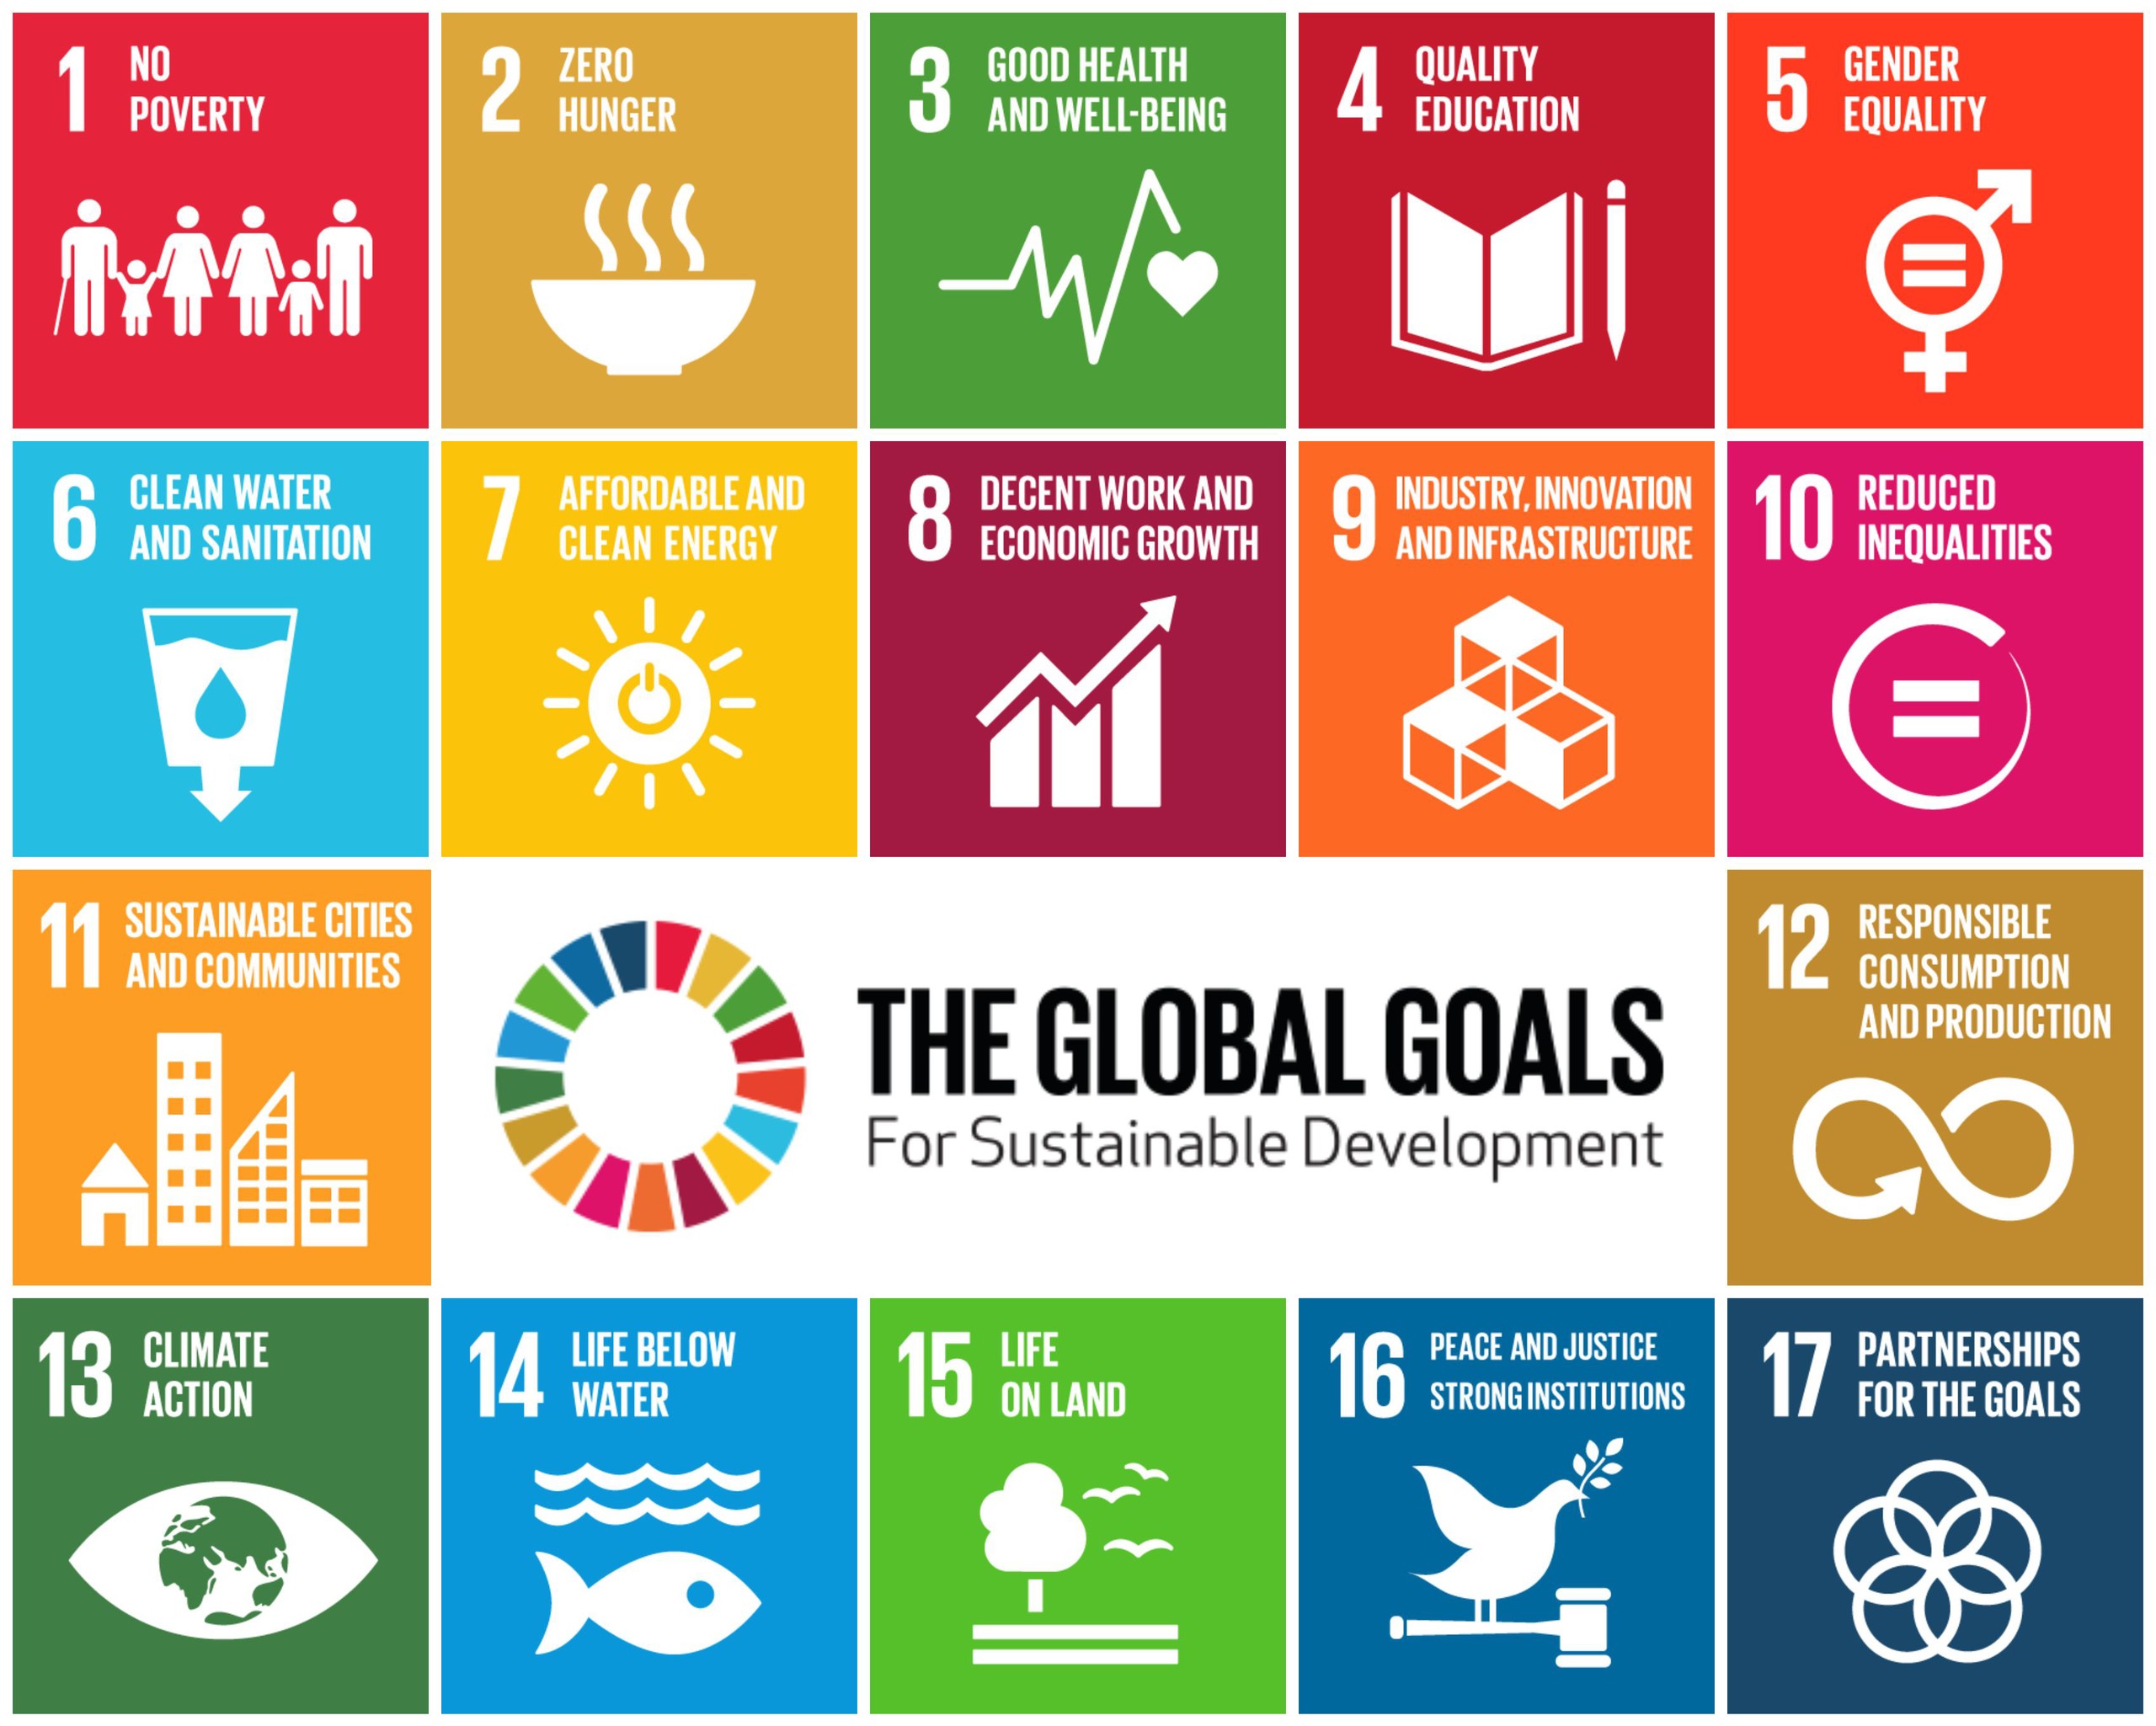
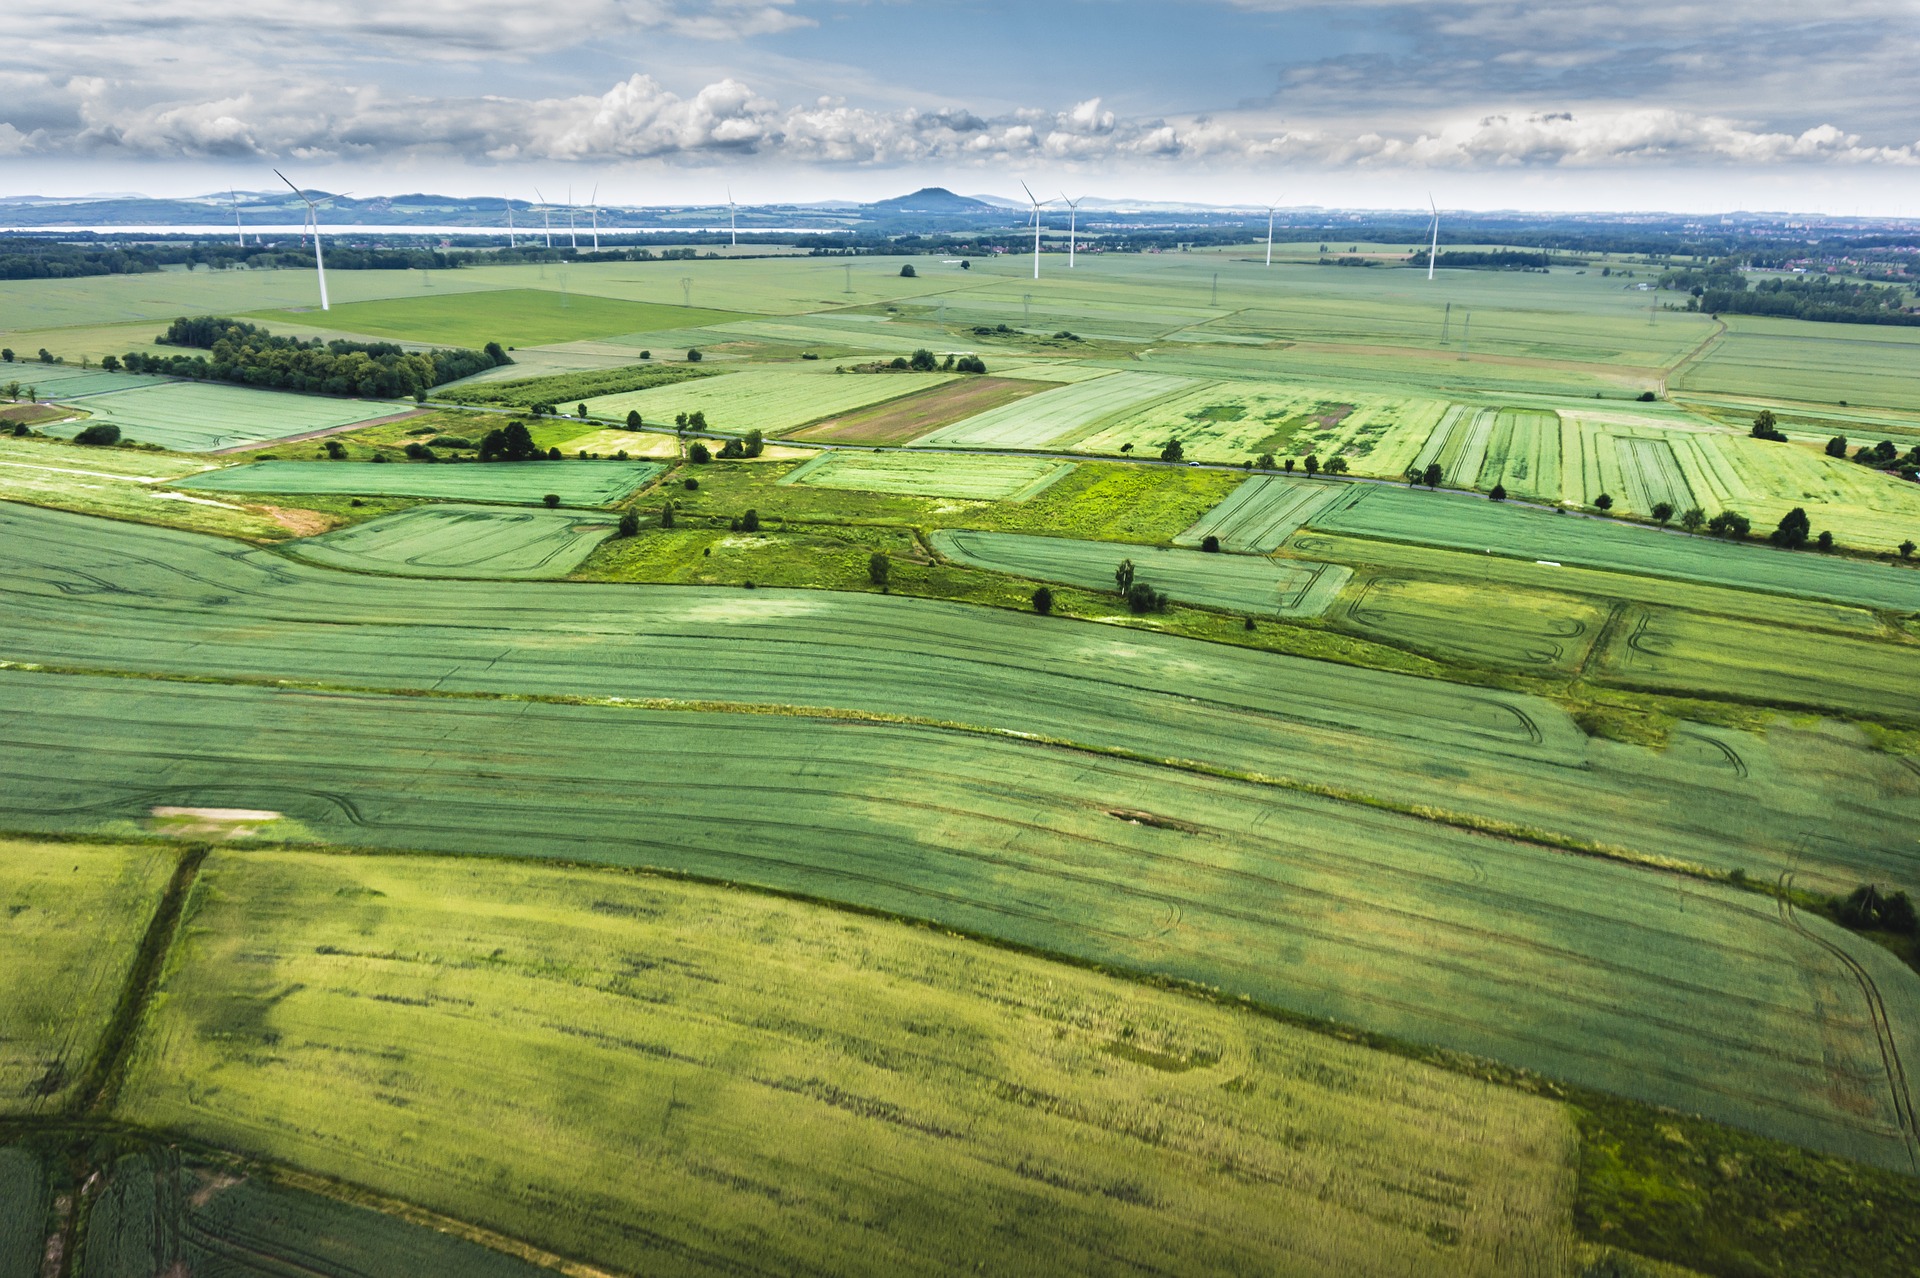
The following maps were created to measure each country’s progress in SDG 15 (Life on land) and SDG 3 (Good Health & Well-being), in the latest years that data was available for.
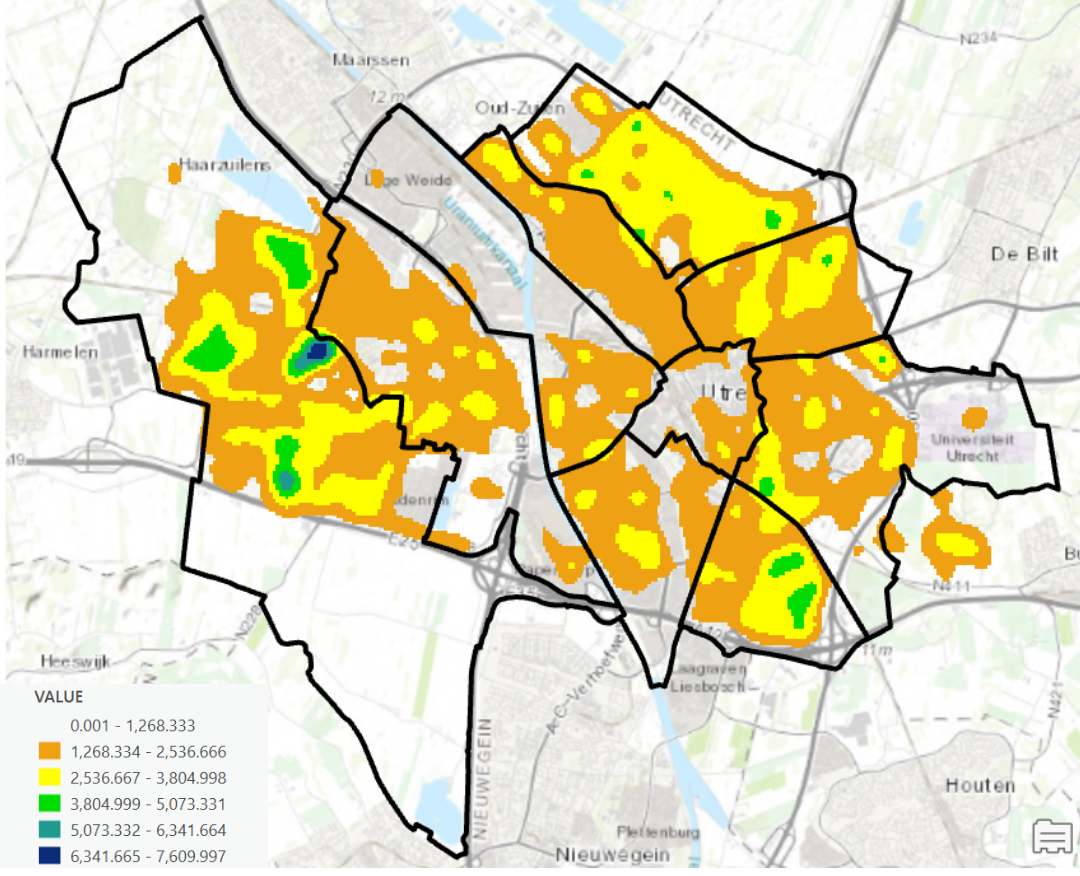
Choropleth & Heat Kernel Density Maps to reveal the distribution of trees between the neighborhoods in Utrecht. Aimed to guide Utrecht's Green Structure Plan and achieve SDG 15 (Life on land).
Land coverage map of Central and Urban Bangalore, India, representing three different classes including water, developed and planted/cultivated. Aimed to guide sustainable urban planning.
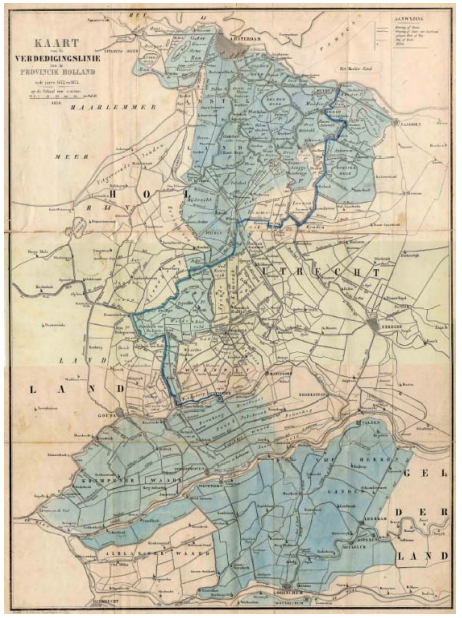
Relative Elevation Model displaying rivers and areas in the that are highly controlled regions around the Hollandse Waterlinie. Focused on the regions of Muiden, Muiderberg, Weesp, Hinderdam, and Hilversumse Meent.
The map displays the Carbon storage capacity of the regions in and around the state of Uttarakhand (in northern India), including its border with Nepal, Tibet and Himachal Pradesh. Aimed to guide forest management and SDG 15.
The map displays how people felt about certain types of tree in and around the proximity of Utrecht Science Park.
A 3D map of Texel Island, The Netherlands, in 2023, generated from LiDAR-a remote sensing technology-data.

This is a Map Gallery, showcasing several of the maps made during my GIS course.
Alcohol consumption per capita (≥15 years age) within a calendar year for the latest year 2019.
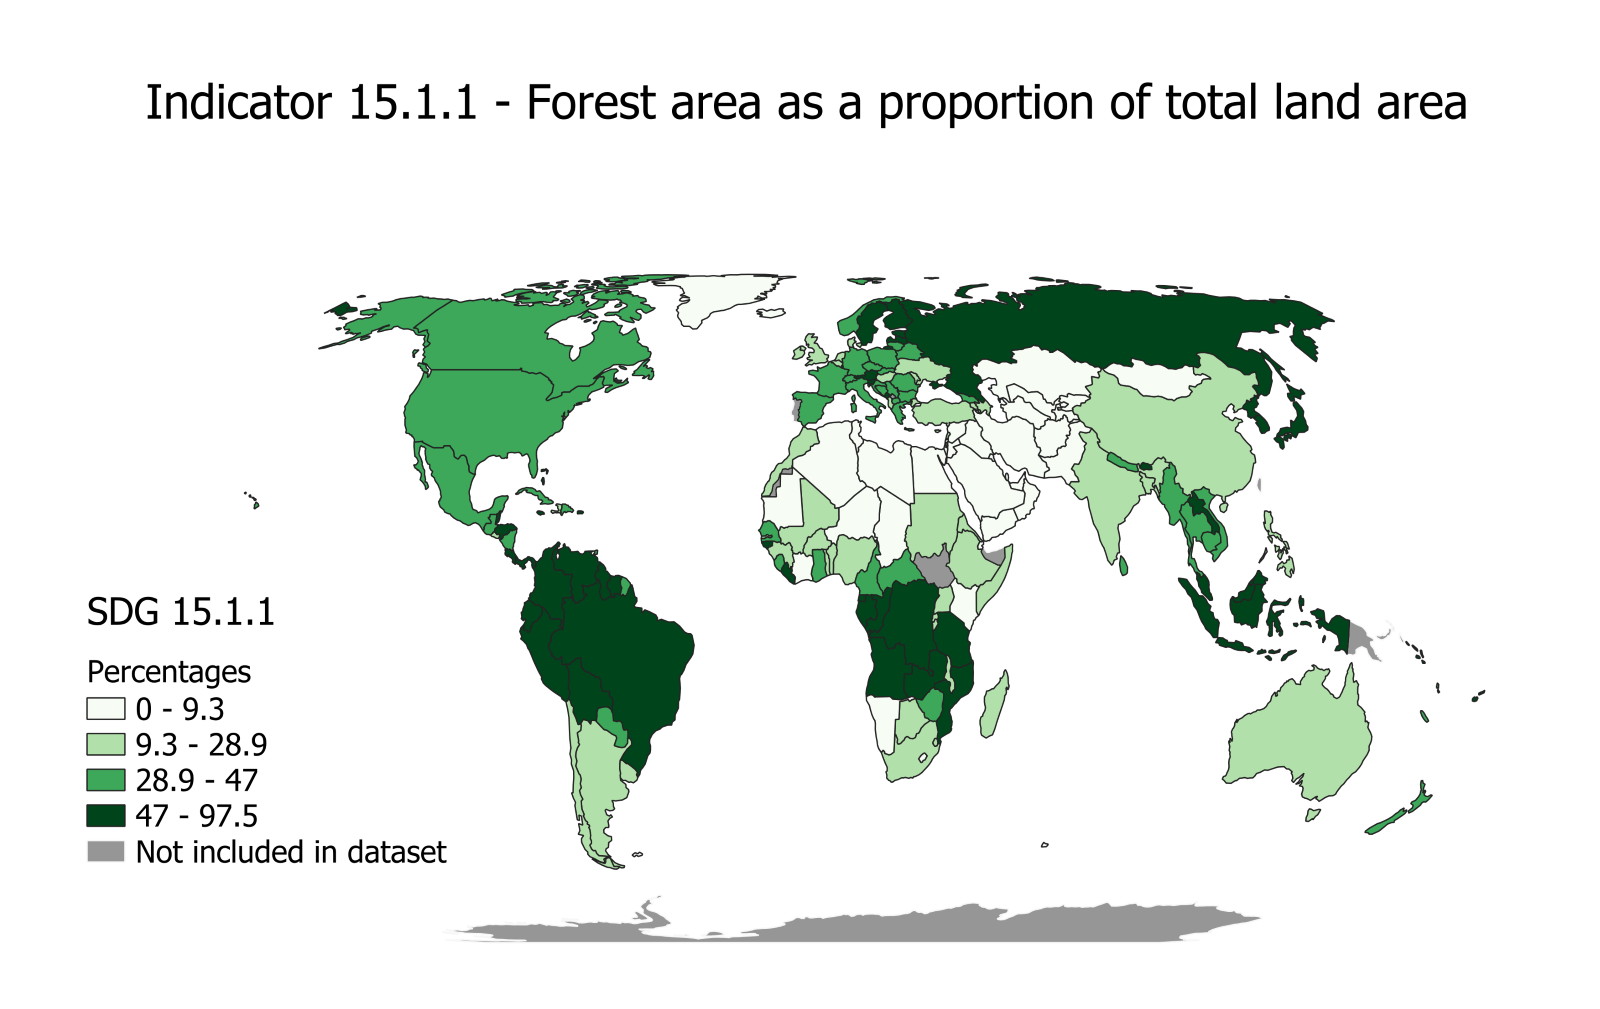
Forest area as a proportion of total land area for the latest year 2020.
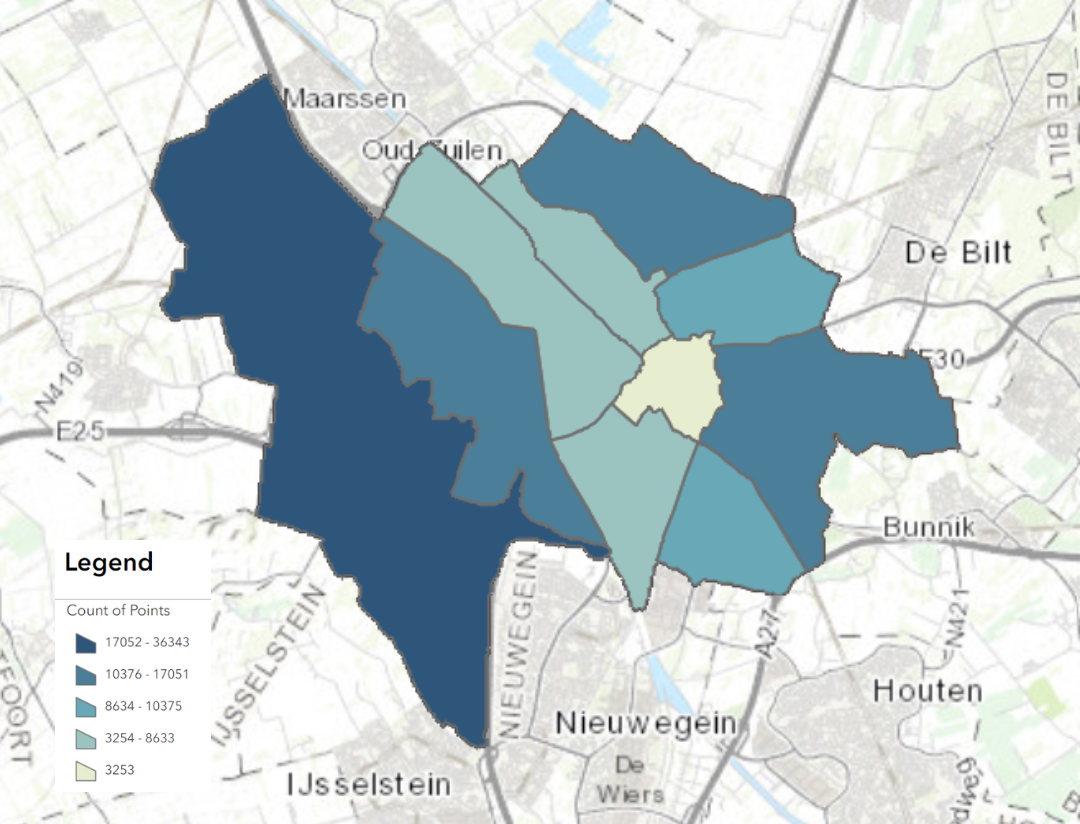
The number of Trees across neighborhoods in Utrecht in 2024.
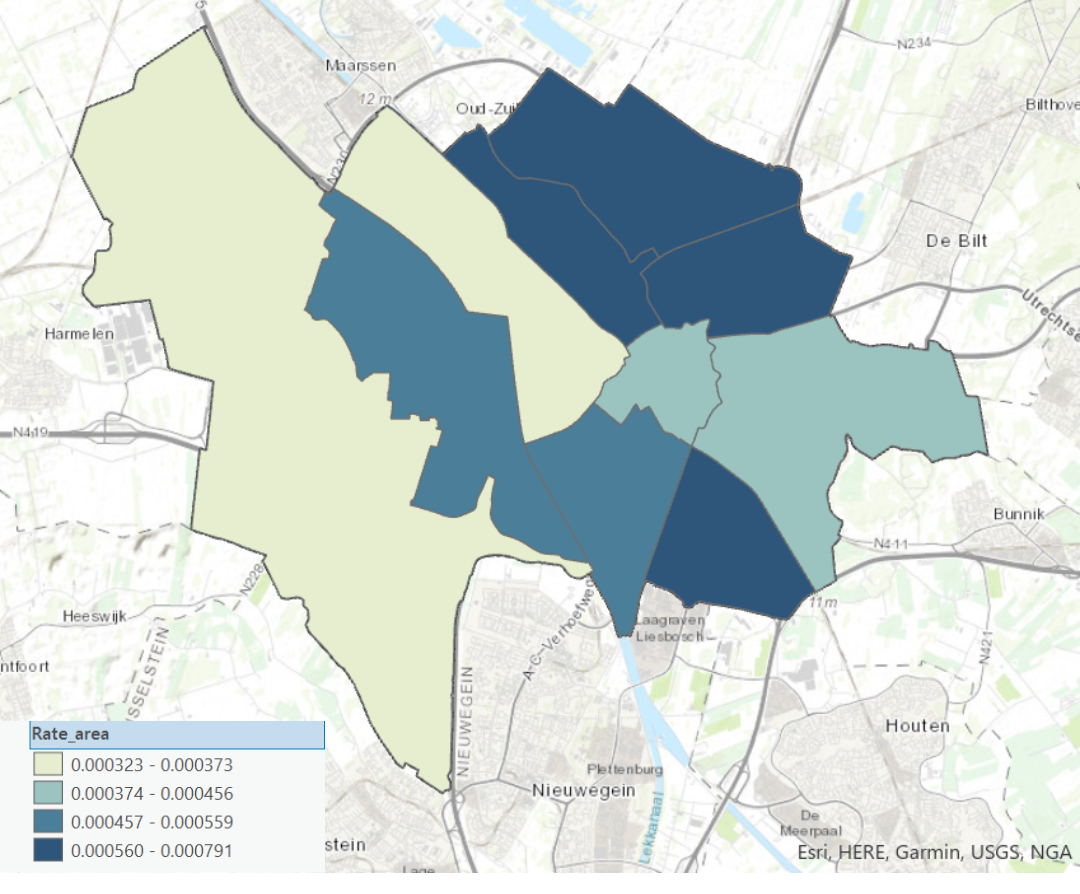
The number of Trees per square meter across neighborhoods in the Utrecht in 2024.
a map highlighting those neighborhoods with the highest tree density. The darker an area is (such as blue), the higher density it represents.
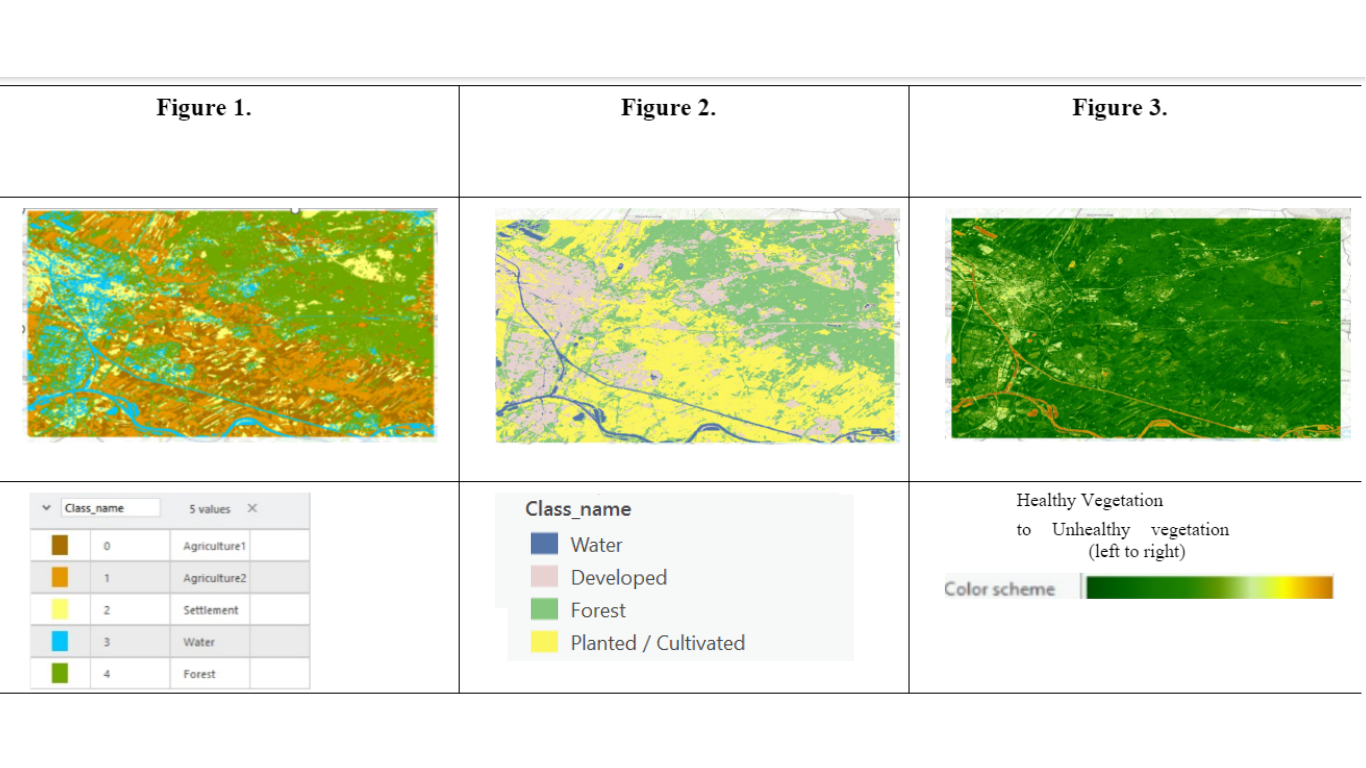
Figure 1.Unsupervised pixel-based classification, Figure 2.Supervised pixel-based classification, Figure3. Normalized difference vegetation index (NDVI)index. Darker green regions represent healthier vegetation.
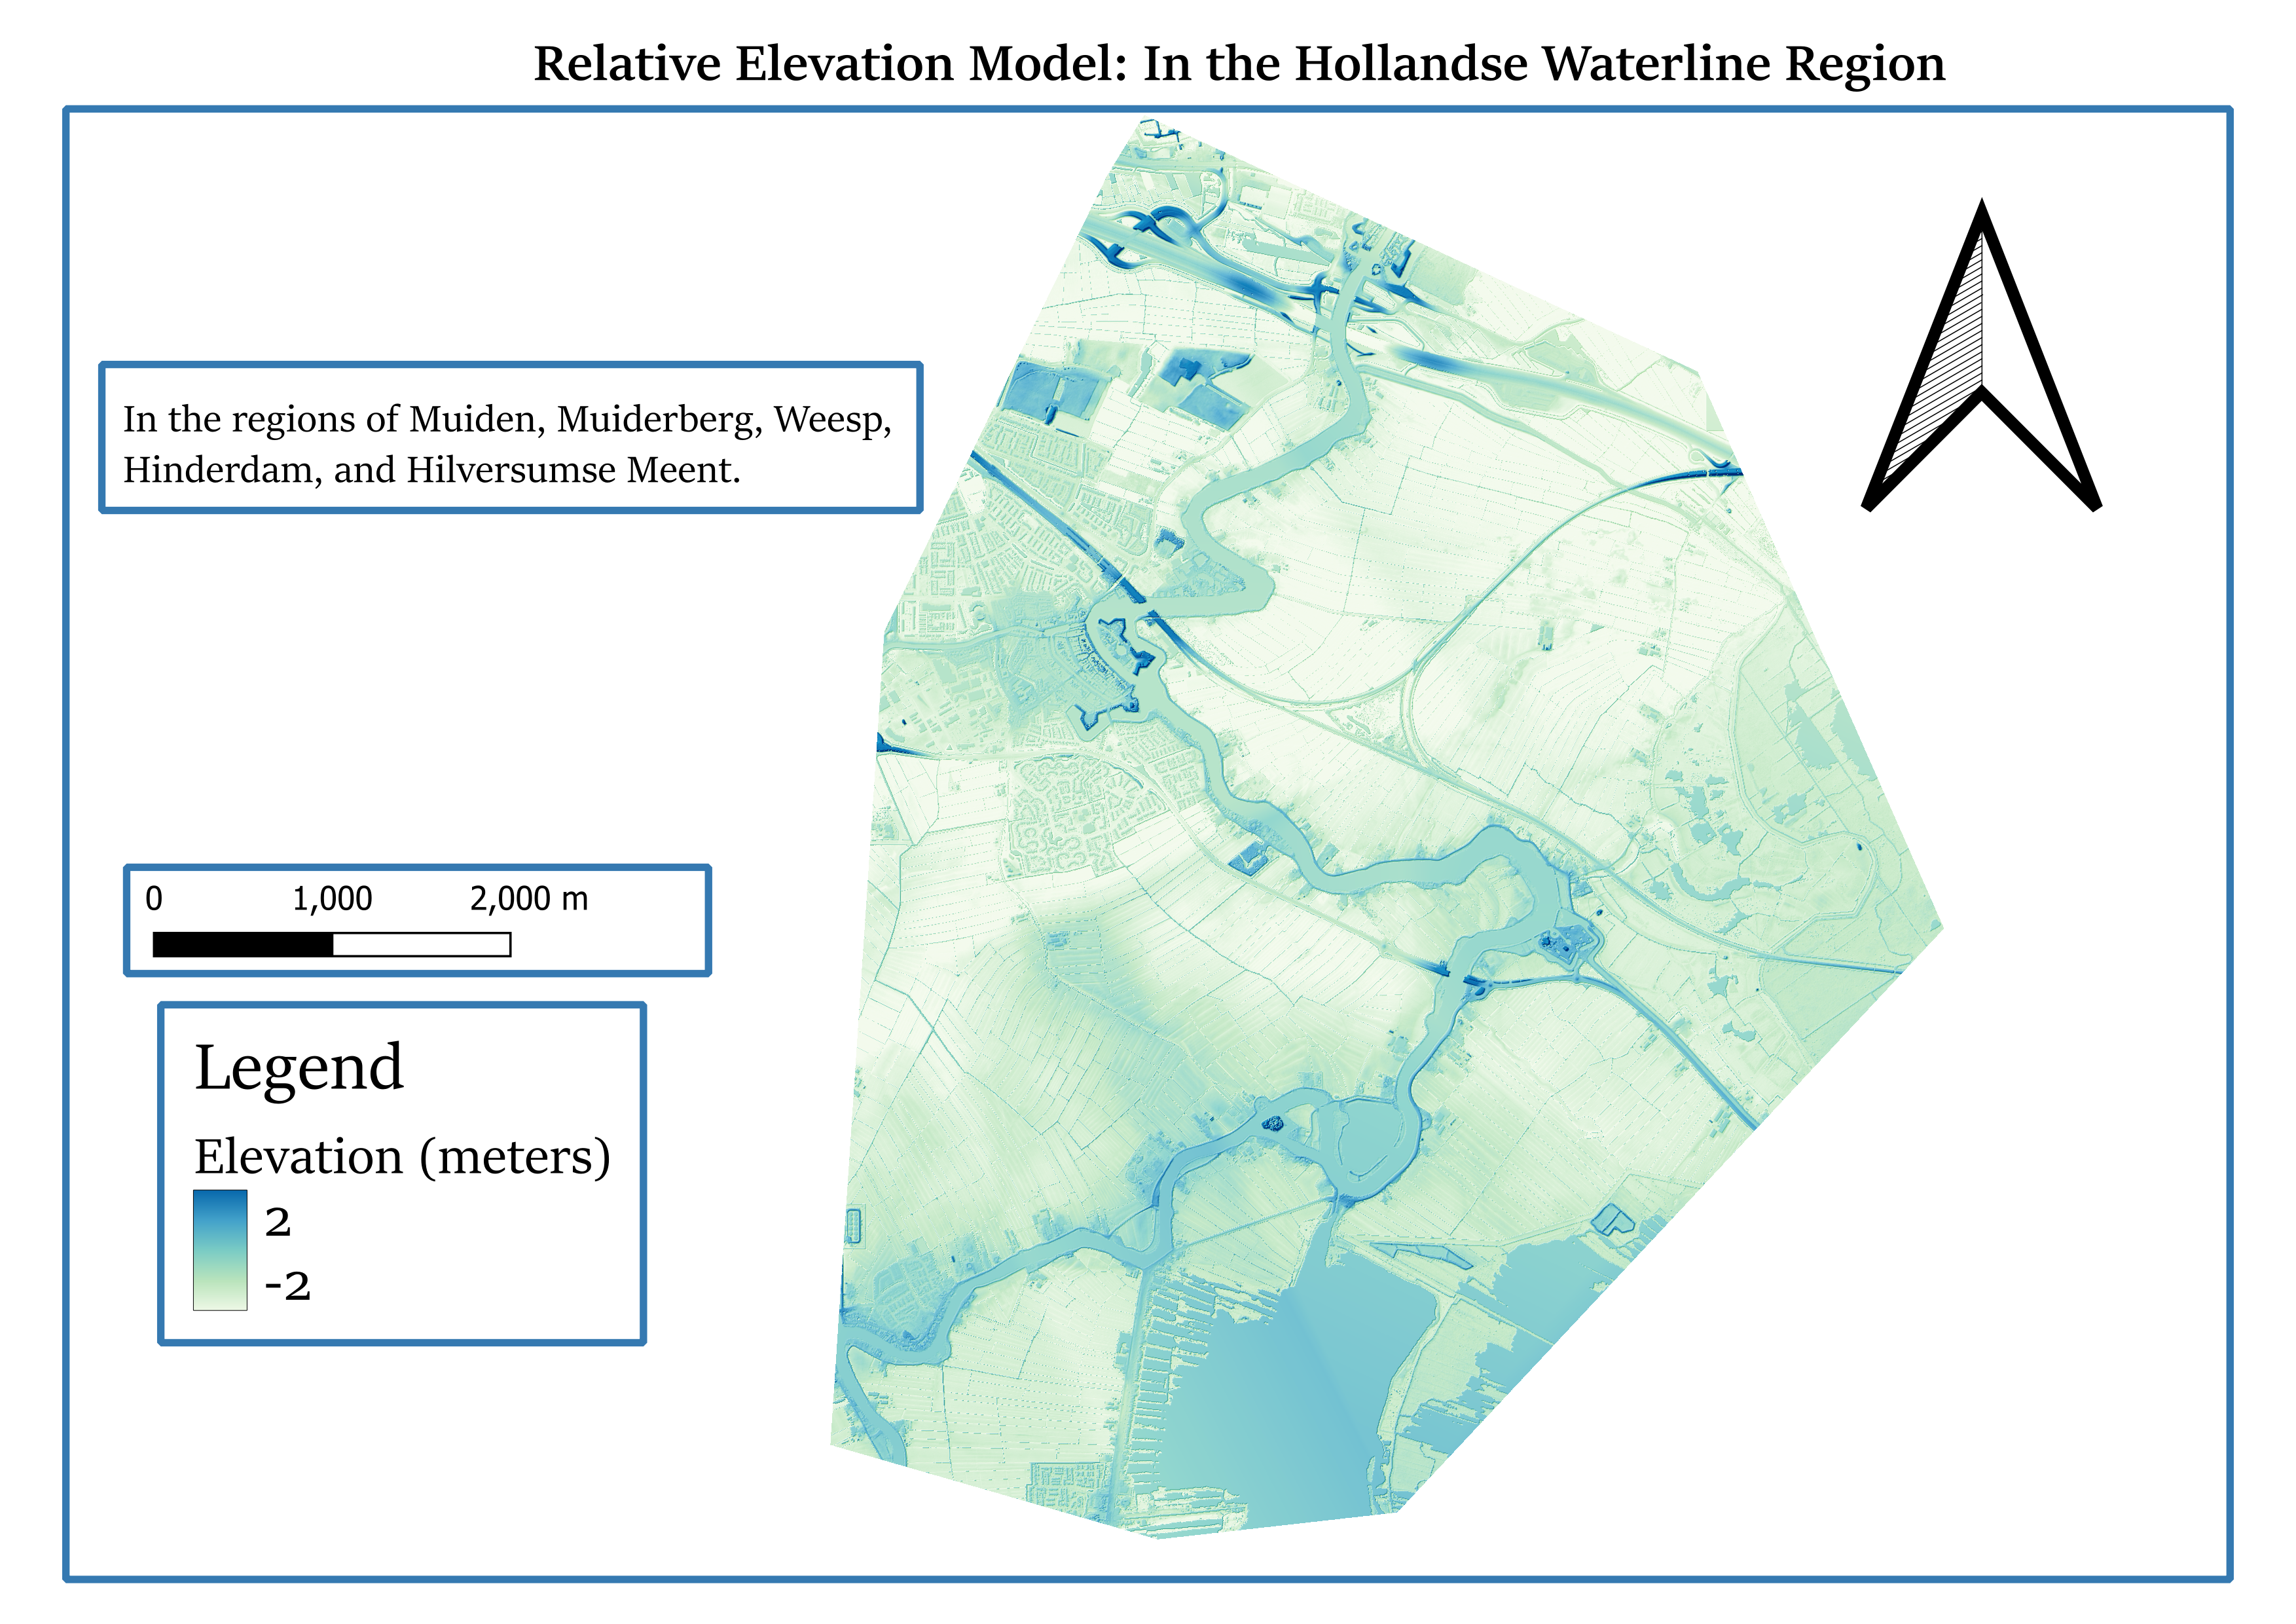
Relative heights of regions the Hollandse Waterline passes through.Along the Waterlinie, the slope increases from downstream to upstream. Additionally, the land, whiter than the river, appears to have a lower elevation.
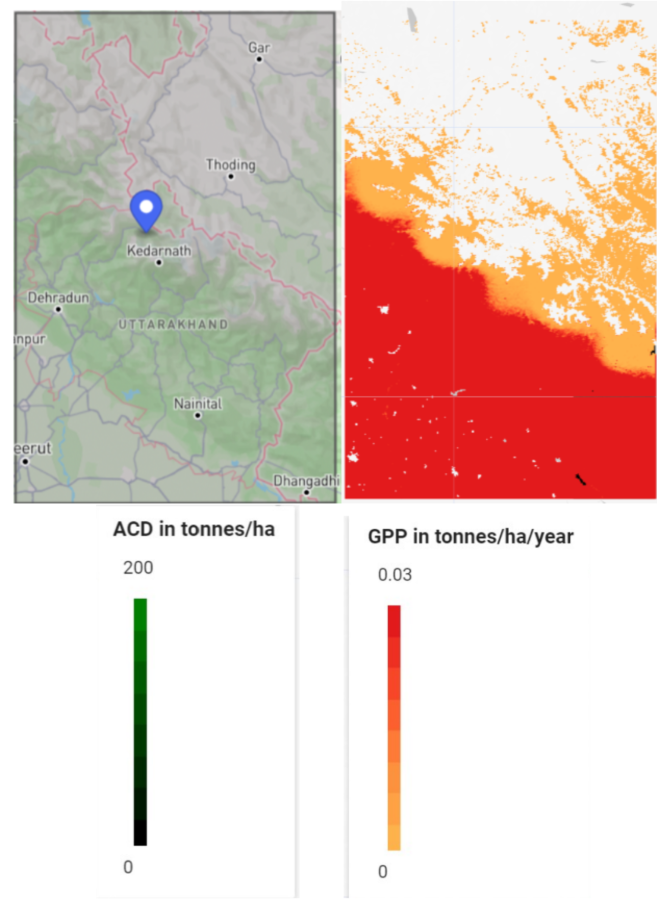
Region of Interest: Uttarakhand and its borders with Himachal Pradesh, Tibet and Nepal. Figure 2 shows Dhangadhi (bottom right corner)region having high GPP, low ACD, & thus high CSPI.
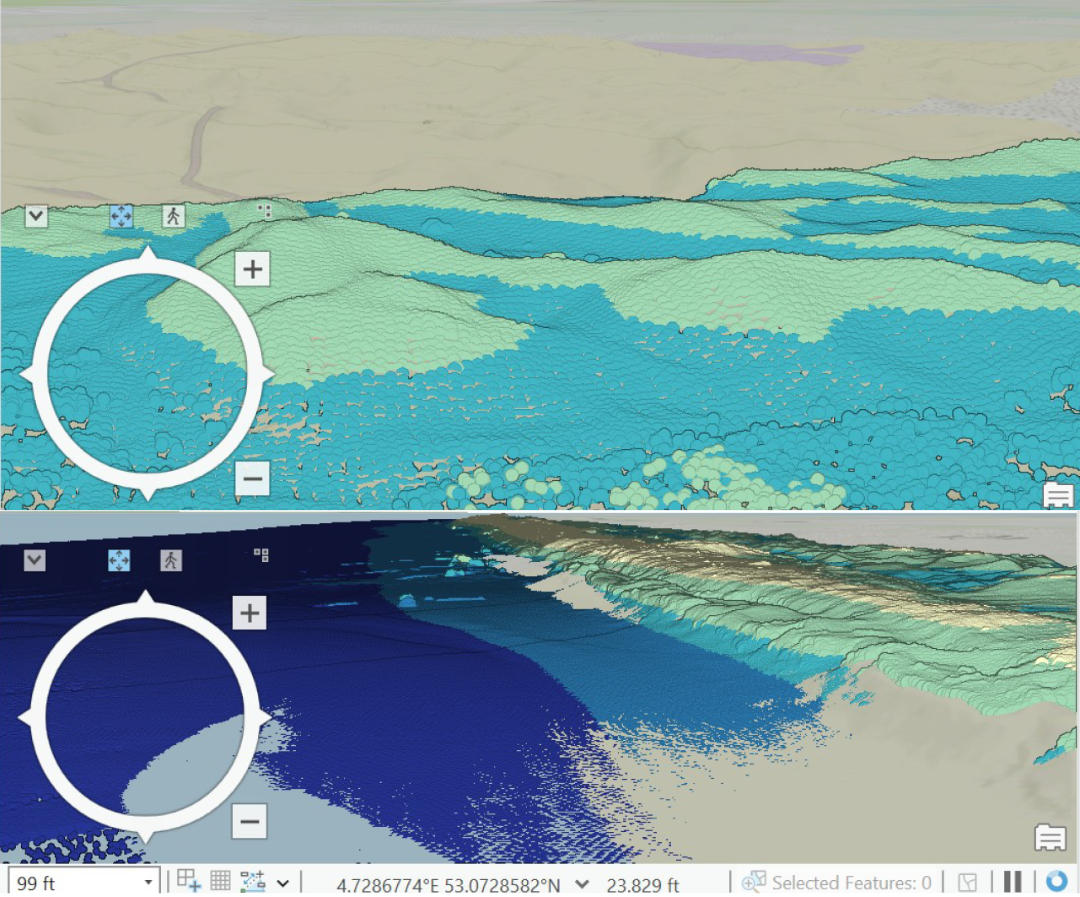
It showcases the elevation differences between different features in the island, namely open water, dunes, among others. Displays higher elevation by the coast, towards the dunes, and lower elevation in the open water