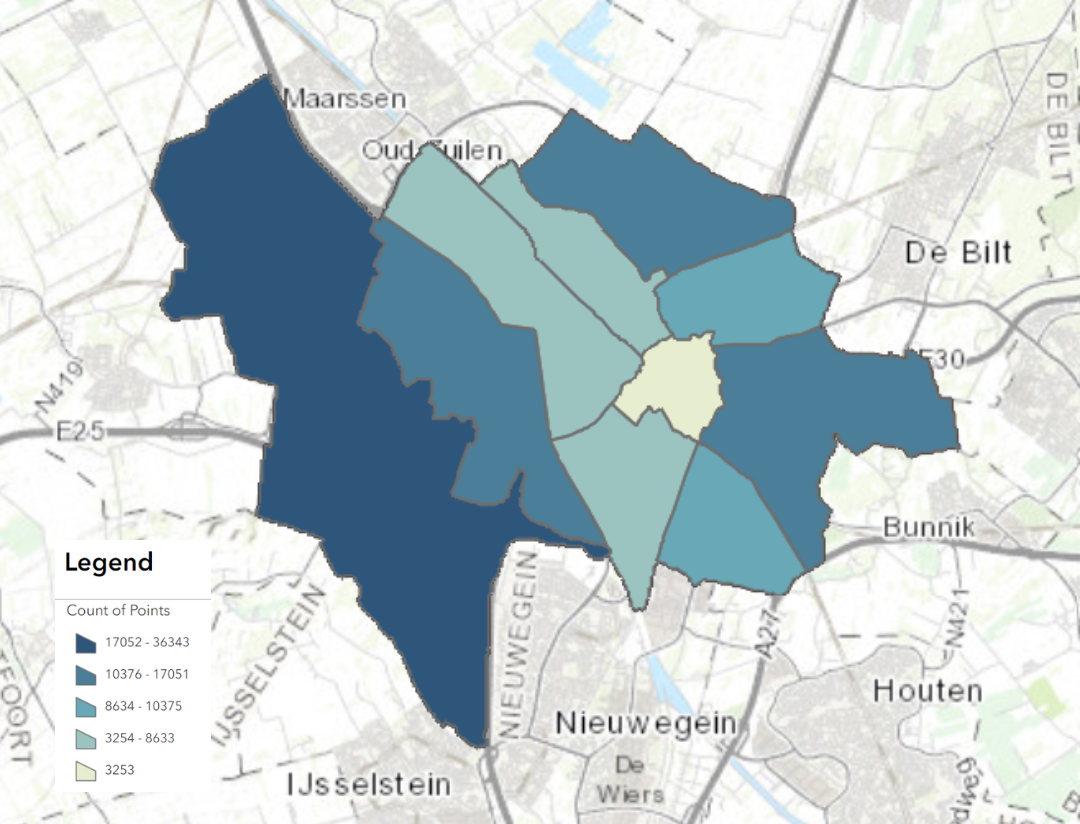
Figure 1. Tree Count Choropleth Map, 2024
The number of Trees across neighborhoods in Utrecht in 2024.
Maps for spatial planning regarding tree cover in Utrecht in 2024
SDG Goal 15 aims to protect, restore, and promote the sustainable use of terrestrial ecosystems, manage forests sustainably, combat desertification, and halt land degradation and biodiversity loss. It has 12 targets to achieve by 2030, measured by 14 indicators. In line with this, Utrecht has a Green Structure Plan 2017-2030 focused on using green and blue infrastructure and restoring ecosystems. In urban planning, it aims to considers the benefits of trees in improving air quality, reducing the urban heat island effect, and sequestering CO2, as well as their positive influence on creating a healthier city.
Thus, recognizing the importance of trees in local ecosystems and the negative impact of invasive species, it is crucial to include biodiversity data in urban planning. Hence, this project aims to transform tree data into informative maps, making complex information easy to interpret and potentially revealing new insights. The following maps can guide policy decisions on promoting tree growth and reducing the impact of invasive species in Utrecht, relevant to SDG indicators 15.8 & 15.9 & the Green Structure Plan.
As for the two types of maps created in this project: while a choropleth map is a type of map that shows the percentage or distribution of a variable of interest within geographical boundaries, a heat map does not have any correlation to geographical or societal boundaries and instead represents the density/intensity of data points (trees in this case) in a given area by using colors or shading.
These map, revealing the distribution of trees between the neighborhoods in the Province of Utrecht, can help guide Utrecht's Green Structure plan and achieving SDG 15. The Interactive map above (Figure 1 in the Map gallery below) uses the number of trees ("Count of Points") as the attribute for the choropleth map, the second choropleth map (Figure 2 in the Map gallery below) uses the rate-area (the number of trees per square metre of a neighborhood) as the attribute. Since the rate-area map uses and displays proportional data, it is more relevant for sustainable urban planning, rather than the interactive Tree Count map. Acordingly, from the kernel density map (Figure 3 below), we can see that they are most concentrated towards Oost, 20kms from Utrechtse Heuvelrug National Park. This reveals the importance of establishing and maintaining national parks for indicator 15.a on strategic conservation efforts.
The map was made using vector data on the number and type of trees in each neighborhood in Utrecht publicly available in The Netherlands. The vector data was then transformed into a Choropleth Map and a Heat Kernel Density Map on ArcGIS Pro to provide a visual understanding about the distrubution of trees between neighborhoods in Utrecht.
The three maps about Tree Cover distrubution across Utrecht
The number of Trees across neighborhoods in Utrecht in 2024.
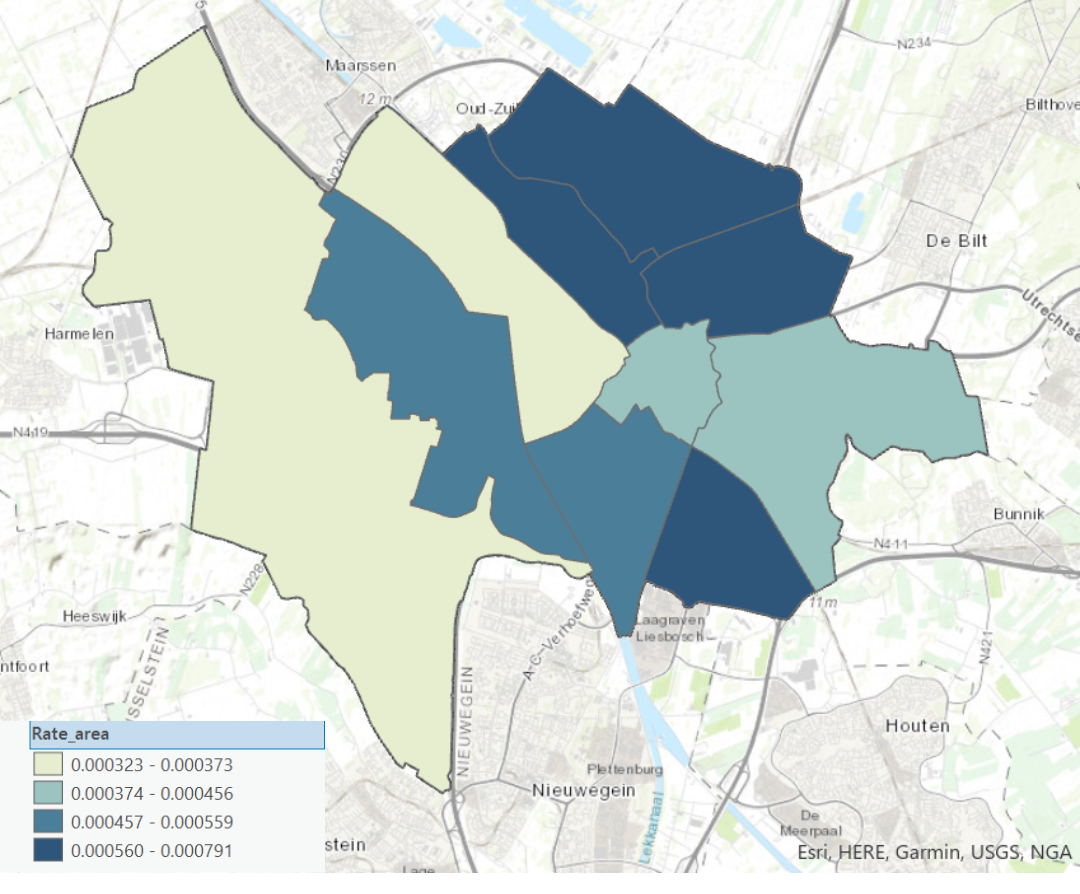
The number of Trees per square meter across neighborhoods in the Utrecht in 2024.
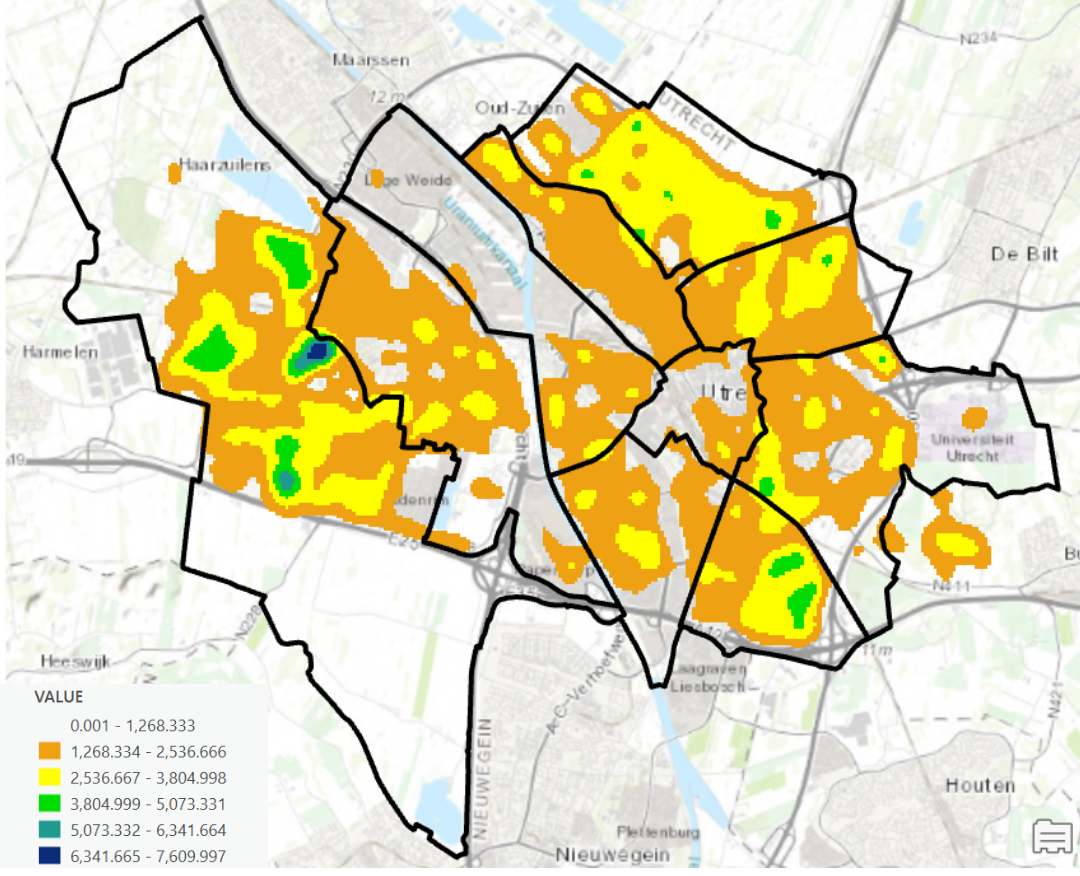
a map highlighting those neighborhoods with the highest tree density in 2024. The darker an area is (such as blue), the higher density it represents.