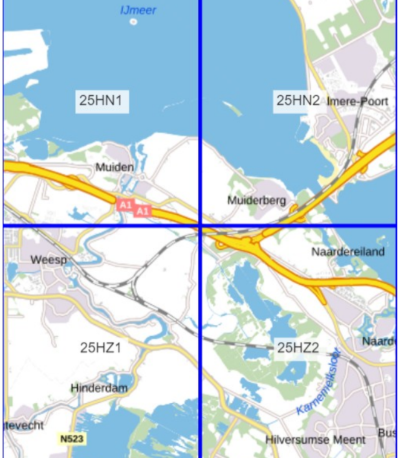
Figure 1. Map of the Region of Interest
in the regions of Muiden, Muiderberg, Weesp, Hinderdam, and Hilversumse Meent.
In the Regions of the Holland Waterline
While in a Digital Terrain Model (DTM) you can see the mode fields, in a Digital Surface Model (DSM) you can see trees, buildings, but loose variations in height. On the other hand, an REM shows more variations in height and showcases greater detail. In these Digital Elevation Models, color variations reflect the height/elevation. In cartographic design, changing color schemes can make different perspectives and information pop-out.
This REM displays rivers and areas in the Netherlands that are highly controlled: regions along the Hollandse Waterlinie. The area in Holland that I chose covered three tiles (namely N1, Z1 & Z2), South-East of Amsterdam (as shown in Figure 1 below). I chose this area because Hollandse Waterlinie passes through it, and thus would enable me to create a Relative Elevation Model of the chosen area using the Waterlinie as a reference point.
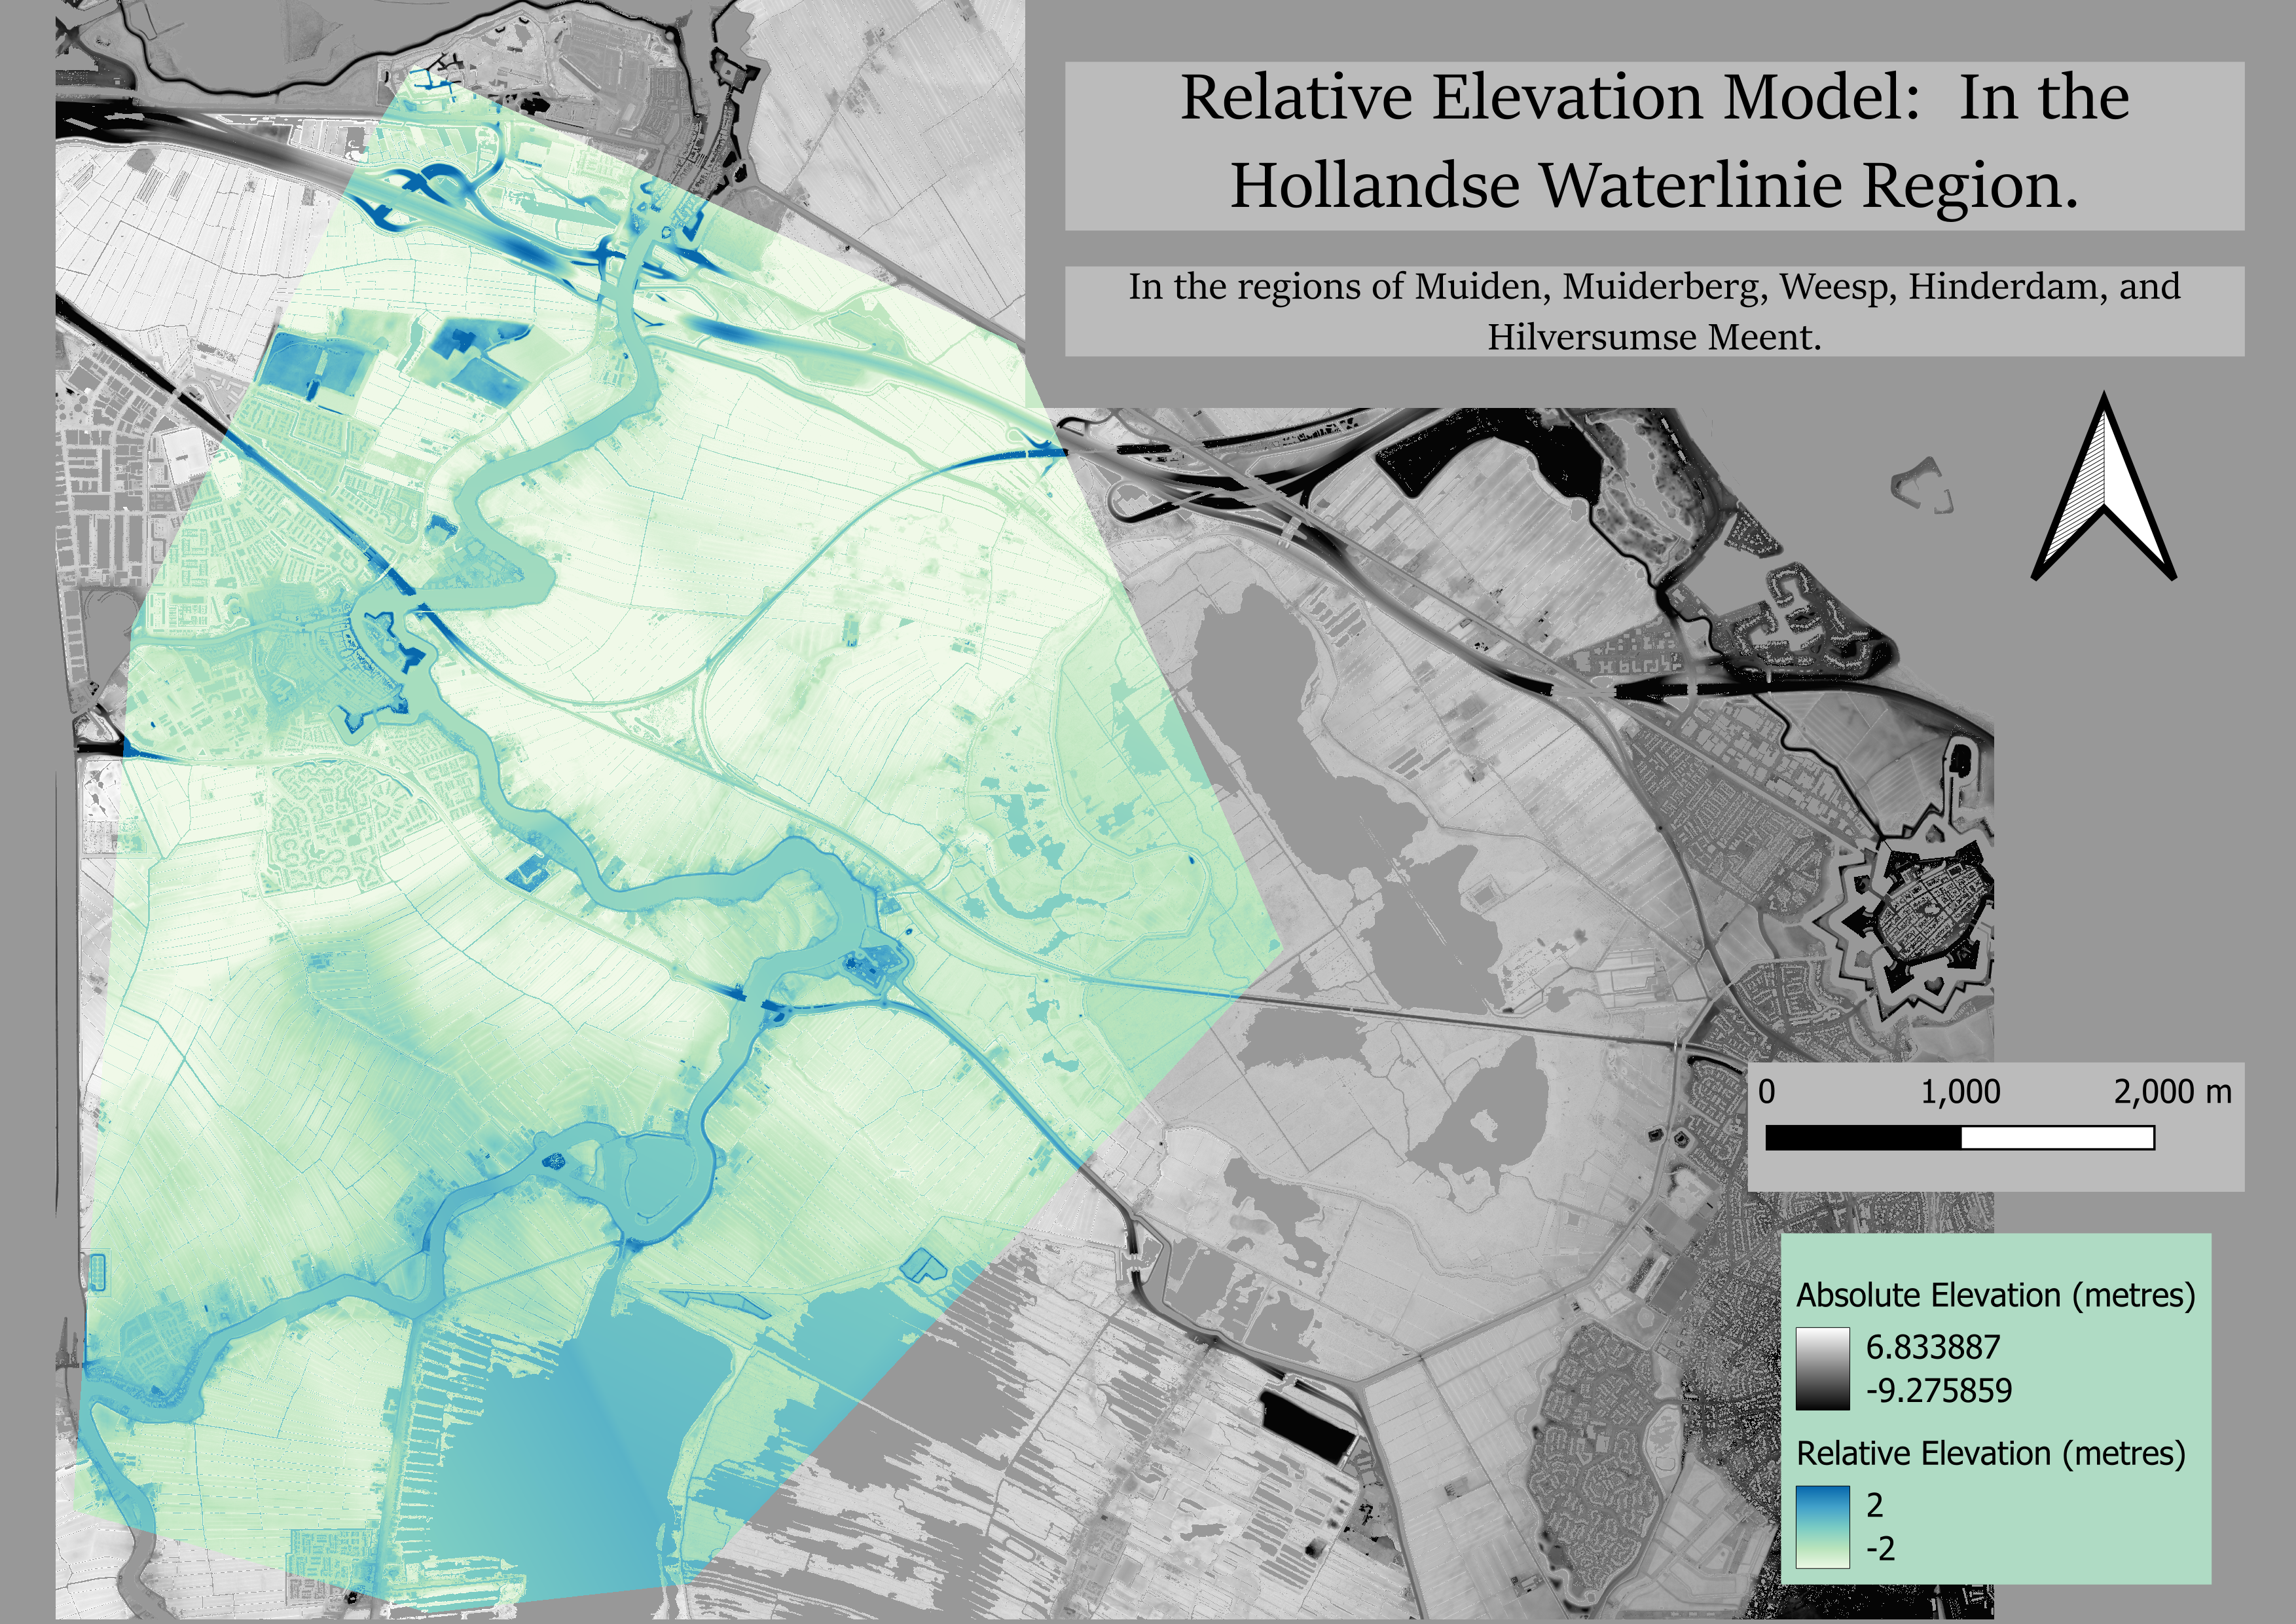
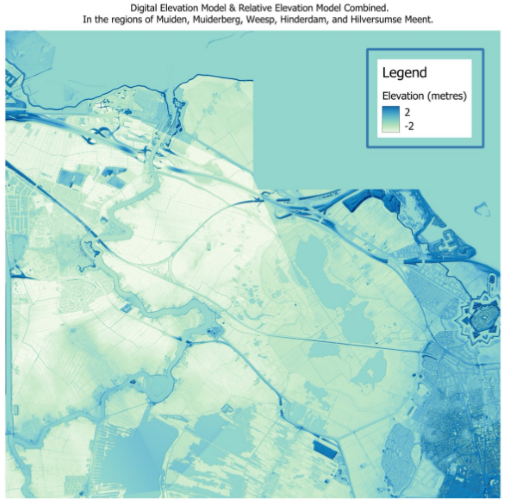
From the colors, it is noticeable that along the Waterlinie, the slope increases from downstream to upstream. Additionally, the land, whiter than the river, appears to have a lower elevation. This, I understood is because most land in the Netherlands were built below sea level and are protected by dikes. Given the whitness of the top regions surrounding the Waterlinie, it seems like this region with the lowest elevations in this REM is prone to floodings. Furthermore, from Figure 2. (below in the map gallery) of the DEM and REM layers together, the darkest blue region on the map, is in Muiden in the East; the higher elevation can be explained by the Castle: Kasteel Muiderslot.
This REM was derived from a DTM sourced from LiDAR data. After importing the datasets to QGIS, and creating a shadow layer over the DTM, the colors confirmed that the river was at an elevation of 0, while the surrounding dikes were at a higher one, and the land area being mostly at lower elevation values.
We conducted a spatial interpolation using Triangle Irregular Network (TIN) method to find the value of the regions surrounding the Waterlinie, using the Waterlinie (has a known value of 0) as a reference point. This formed a new layer in which an elevation value was given to a feature is based on its relationship to the Waterlinie.
Finally, to obtain the REM values of the surrounding areas, we subtracted the interpolated values from these manually cross-sectional values of the river edges. The final REM, compared to the initial DEM, shows starker differences in the color in the landscape surrounding the river. There is a starker color gradient, with whiter regions representing lower elevations, and darker blue regions representing higher ones.
in the regions of Muiden, Muiderberg, Weesp, Hinderdam, and Hilversumse Meent.
REM in the regions of Muiden, Muiderberg, Weesp, Hinderdam, and Hilversumse Meent.
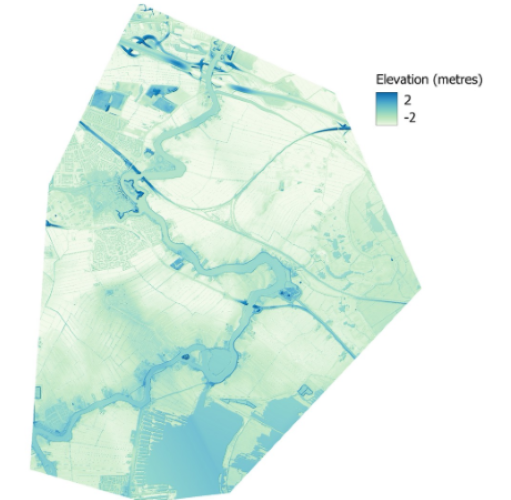
REM of selected region South-east of Amsterdam, where the waterline passes through. Bluer regions have a higher elevation than whiter ones.

REM of selected region South-east of Amsterdam, where the waterline passes through. Orange regions have a higher elevation.