A map showing landcover classification across neighbourhoods in Urban and Central Bangalore towards the end of 2023
While landcover indicates the physical surface of the Earth’s surface such as forest or water, land-use is the socioeconomic and functional use of these lands. Land-use can influence landcover, and vice versa, and has implications for SDG goals such as SDG 11 (sustainable cities and communities) and SDG 3 (good health and wellbeing), among others. Land cover data and maps can aid monitor SDG achievement targets and assist policy-making and urban planning. Furthermore, inter-year comparison of land cover maps can also reveal land use trends and changes, giving us a window into the past.
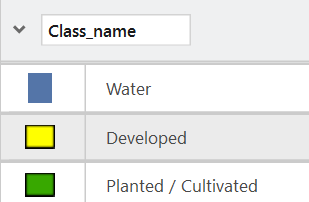
This is a land coverage map of Central and Urban Bangalore, India. Despite the limited three classifications of landcover, namely developed, water, and planted/cultivated, it reveals that most of the land is developed, while there is limited open water. This data also highlights the unsustainable development and water shortages that Bangalore is facing currently. To elaborate, this is the city that I grew up in and was once called the “garden city,” known for its abundant greenery. It had a network of man-made lakes to supply water to its growing population. However, since the 1990s, overcome by rapid urbanization has resulted in 83% of the city being covered by concrete. Thus, it has limited vegetation and groundwater. This statistic is reflected in this landcover classification map as well.
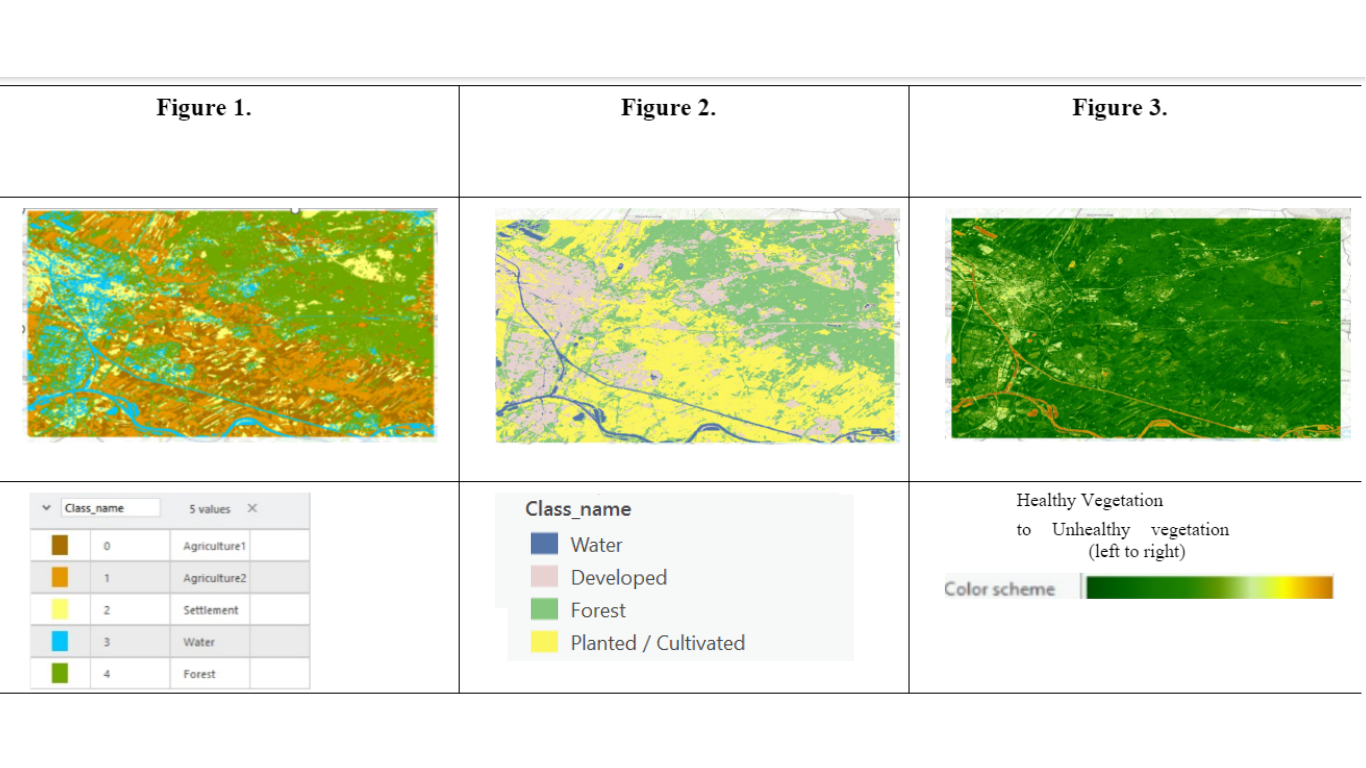
The project introduced us to remote sensing, and we moved from working with vector data to raster data. Remote sensing is making observations from far away/remotely and then analyzing it and using technology such as satellite imagery. The resulting raster data is a datatype that is continuous and has pixels with classes. In this map, we used data sourced from remote sensing satellite imagery from Sentinel-2, from Google Earth Engine (GEE). The final map was made on ArcGIS pro using the Supervised pixel-based classification. Although we had to manually assign pixels to different classes of land cover (like water, developed, etc...) by manually selecting regions in the map that corresponded to each class (and I was not able to find suitable pixels for each the land cover class), the supervised pixel-based appears to have produced the most readable and accurate map. However, this map does not distinguish between the different types of vegetation like green agriculture and forest.
Figure 1.Unsupervised pixel-based classification (Automated assigning of classes to pixels). Figure 2.Supervised pixel-based classification (manual assigning of classes to pixels). Figure3. Normalized difference vegetation index (NDVI)index-darker green regions represent healthier vegetation.